Friday, April 17, 2015

Visiting Laupāhoehoe and Kalōpā

Last month a friend and I took a trip up the coast of Mauna Kea to visit the Kalōpā State Recreation Area. This is a small state park located 2,000 feet (610 meters) up the flank of Mauna Kea, with a small patch of native forest. Along the way we stopped at Laupāhoehoe Point, a small rocky tongue of land sticking out of the mostly high cliffs along the Hāmākua coast. Getting down there requires navigating a winding road hugging the face of the cliffs nearby, which gives some really nice views of the cliffs as you descend:

Descending along the cliffs towards Laupāhoehoe point (looking southeast).

From the point, the view back along the coast to the southeast was pretty neat (it helps that the weather was beautiful):

Click for a larger version.
(Edit 11/6/18: I've replaced the original hand-made panorama with one from Hugin, but you can still see the original one by mousing over the image above.)

The trade winds were blowing stiffly from the northeast, kicking up some impressive waves on the rocks. I tried to catch some of the amazing pictures that resulted:


Anyway, after having lunch at the point, we headed back up the flank of the mountain to get to the park. The high elevation led to a pleasantly cool temperature as we hiked through the forest made up of native ‘ōh‘ia lehua and kōpiko trees.

Kōpiko are the tall thin ones, ‘ōhi‘a aren't really visible.
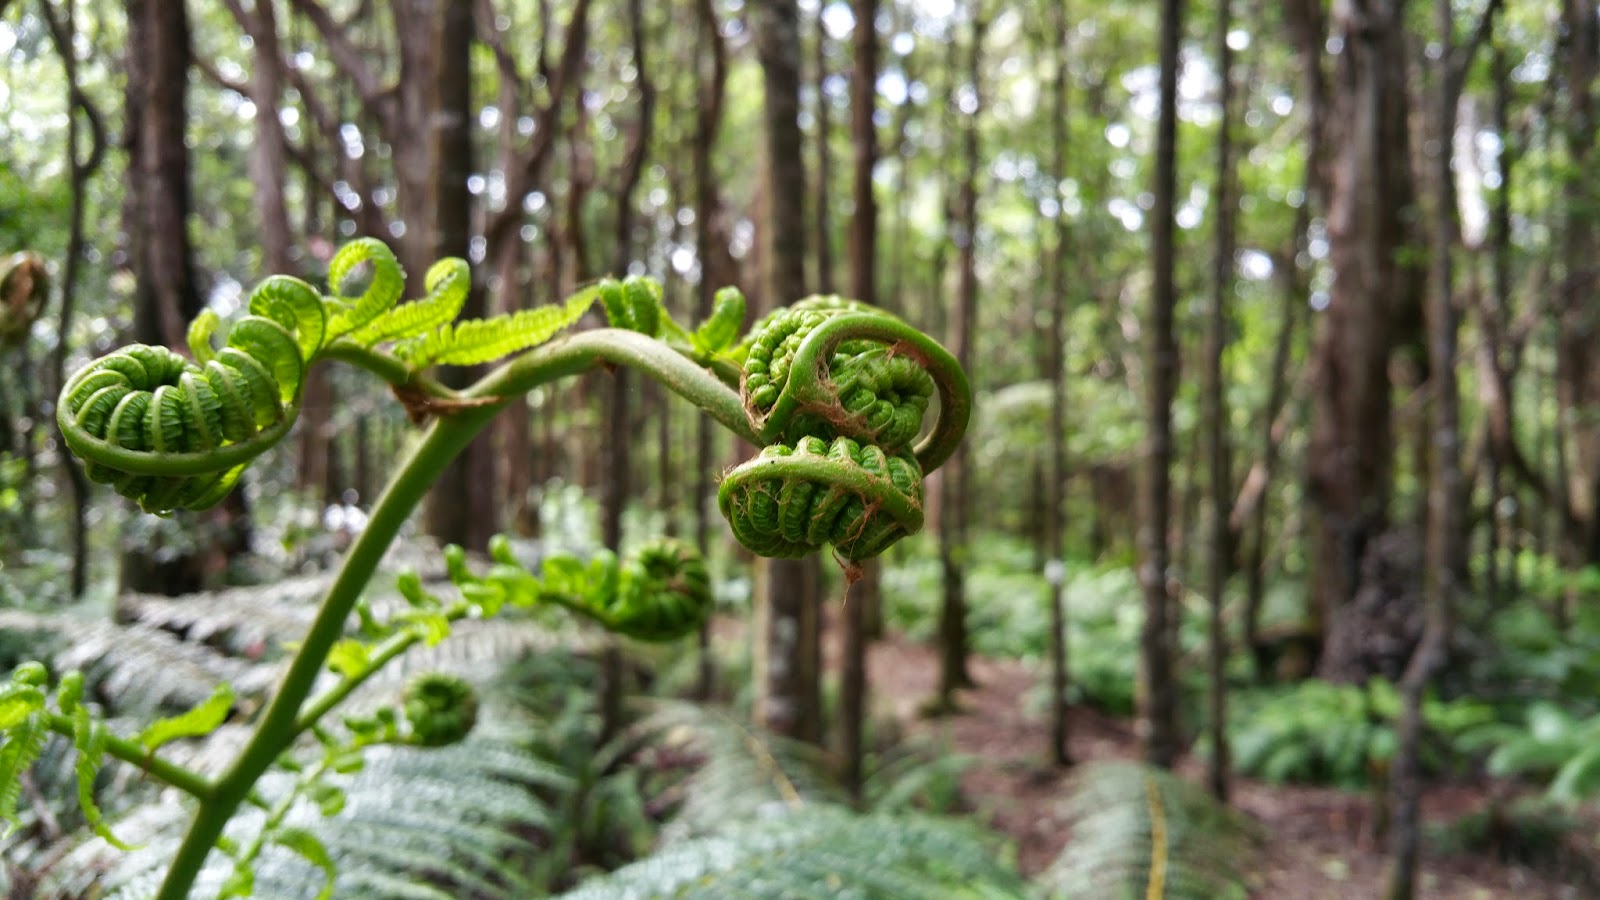
We took a nature trail which was established in 1976, which had a nice informative pamphlet pointing out various sights along the trail. There were tons of different kinds of native ferns in different parts of the forest, some of which were rather pretty:


I even found a single orchid in bloom:


This angle makes it look like the orchid is about to attack me.

All in all it was a nice little jaunt through a native upland forest. There were a variety of other interesting sights along the way (such as a number of invasive strangler figs at various points in their life cycles), but due to the thick foliage they proved difficult to photograph. If you ever get the chance to check it out, I'd definitely suggest it. The one caveat is that we got lucky with clear skies; the Hāmākua coast has some of the highest annual rainfall levels in the state (and the world), due to the humid trade winds blowing in from the northeast and running into Mauna Kea, so it rains pretty often. But if it's not raining, it's a nice place to see some native flora. A hui hou!

Saturday, March 21, 2015

Visiting Pu‘u Huluhulu

Back at the beginning of the month I took a trip up Saddle Road to Pu‘u Huluhulu in order to pick up some cinder for use in my comet-making presentation. Pu‘u Huluhulu is a cinder cone at the base of Mauna Kea, on the Saddle region between it and Mauna Loa (its name means, roughly, “hairy cinder cone” due to the trees growing on it, which contrast with the barren lava fields all around). Here's a shot of me at what I've read used to be a cinder quarry on the west side of the pu‘u.


 The day was really overcast and intermittently rainy, so there was a lot of moisture condensed on the foliage. (The white patch behind my head in the picture is actually a bunch of tiny hailstones, which must have happened pretty shortly before I got there.)

Many of the trees that cover Pu‘u Huluhulu (and give it its name) have this really neat looking lichen growing on them. I got some interesting pictures of it with a low depth-of-field:


At the top of the cinder cone is a flat patch, from where you can look out across the Saddle region. This picture looks towards Mauna Kea – if you enlarge it you can see the Mauna Kea access road winding its way up near the center. Fifteen minutes after that picture was taken the clouds descended to completely block that view.


Pu‘u Huluhulu isn't a very large cinder cone, and after half an hour I'd traipsed over most of it and gotten enough pictures to satisfy the artistic urge (most of them weren't really interesting enough to show). It's a pleasant little hike if you ever get the chance – despite being nearly a mile in elevation, it's short enough to keep you from getting too winded while hiking it. A hui hou!

Sunday, March 8, 2015

Making a Comet


This past week I took part in Journey through the Universe for the second time. Journey through the Universe is an annual event, running for the past eleven years, where astronomers and engineers from the various observatories on Mauna Kea go into classrooms and give talks to the students there. Most of the time these talks include some sort of physical demonstration or hands-on activity. This year I talked about comets, and as part of my talk I created a miniature comet.

Comets are basically, in the immortal words of Fred Whipple, “dirty snowballs.” They are composed of varying amounts of rock, dust, and various ices such as water, carbon dioxide, and ammonia. In preparation for my presentation I did a few test runs of the comet-making recipe I found, including two at work which proved quite popular with my coworkers. I took some pictures of the process (though in poor light, unfortunately) and thought I'd share them here.

We start with a plastic garbage bag inside a large plastic mixing bowl. (When dealing with dry ice, you really want to keep it away from metal as the extremely fast cooling of the metal causes it to emit nails-on-a-chalkboard-level screeches.)


Next, we add some dirt and stir it in.


Then, we add a dash of ammonia and some corn syrup, to represent the assorted organic molecules detected in comets. Organic, in this context, is used in the chemistry sense, meaning “a molecule containing carbon.”


Now, we crush up two cups of dry ice by pounding it with a meat tenderizer, add it to the dirty water, and stir vigorously. This produces an impressive amount of fog, making it hard to see what's happening, but you can feel the ice start to freeze up pretty quickly.


When it's mostly frozen, you can pick up the bag and form the comet like a snowball (something I have basically zero experience doing, I should note). When that's done, we've got a comet!

(Man, that light is poor.)

I don't usually take pictures of myself, so this actually took quite a bit of practice, and I got a bunch of melting dirty comet-water on my hand and a cramp in my leg in the process. Here's a close-up look at the comet:


This comet may actually be the best one I've made so far. I initially thought some of the chunks of dry ice were too big, but thinking about it now I think that may actually be a good representation of real comets. After making the comet I stuck it in a pan in front of me on my computer desk and watched it as it melted over the course of a few hours. This last picture was taken about half an hour after making the comet, and show pits where the water ice froze around some dry ice which has now melted, leaving a pitted surface.


This is quite a fun project to do. The part where you mix the dry ice and water is especially visually impressive, and quite popular with bystanders. You'll most likely have dry ice leftover, too, so you can have more fun with it after the fascination of watching a comet melt has worn off. A hui hou!

Sunday, March 1, 2015

JCMT…Transferred!

Yesterday, February 28th, marked my last day as an employee of the Joint Astronomy Centre. Come today I've been officially terminated from my position there and become an official employee of the East Asian Observatory. It's somewhat of an historic occasion; it marks only the second time a world-class observatory has been transferred from one owner to another.

The first was UKIRT back in October, but that involved only five staff members and transfer to two organizations that have both been around for a while (the University of Arizona and Lockheed-Martin). This time there are over thirty of us involved, being transferred to a new organization formally created just last year.

As you might imagine, transferring operations from an organization with over thirty years of history to one with just a few months' worth is a tricky process. We've dealt with all kinds of transfer-related issues in the last few months, and will undoubtedly have more that pop up Monday morning, but the tenacity that led us to stick with the telescope instead of finding different jobs will no doubt see us through. Exciting times, to be sure!

Next week I'm taking part in the Journey through the Universe program again, where I'll being visiting classrooms in Hilo and giving a talk about astronomy. The project I picked this year is quite visually impressive, and I've got some pictures of a test run I did so expect to see those up here pretty soon. A hui hou!

Monday, February 16, 2015

Inkscape, New and Improved

This post is either a little late or a little early, depending on your perspective. The piece of news I wanted to point out is that Inkscape, the free and open-source vector image editing program, has recently had an updated version released. If you read this blog you'll have seen images made using Inkscape, as I use it frequently (the image in the previous post, for instance, was made with the previous version of Inkscape).

Why is this big enough news for me to want to post it, you ask? This particular update is both large, and a long time in coming. Like, almost four-and-a-half years in coming. The version number jumped from 0.48.5 all the way to 0.91! This long period of development apparently resulted in over 700 bugs being fixed, and the addition of a new internal rendering engine which should bring some performance enhancements. There are a whole host of other little improvements and additions, which are better explained in the official release notification.

I mentioned this post could be considered both early and late; it's late, because the new version was actually released at the end of January, but I only learned of it at the end of last week. It's also somewhat early because I haven't actually had a chance to use the new Inkscape version yet; I'm waiting for the packages to be made available for Debian (which Linux Mint Debian Edition uses). It's currently available for Windows, Mac, Ubuntu, and OpenSUSE, though, and I'm sure I'll get to play around with it soon enough. If you're looking for a good vector graphics program, I encourage you to give it a try! And if you aren't, take a look at it anyway; you just might find it to be the solution to problems you didn't know you had. A hui hou!

Sunday, February 1, 2015

OBAFGKM

Every first-year astronomy student at some point runs up against the sequence of letters “OBAFGKM.” (Remembered with the help of the catchy mnemonic “Oh Be A Fine Girl/Guy, Kiss Me.”) All stars are classified according to their spectra and classified with one of these letters, along with some additional information for further granularity. It brings up the question, though: where did this opaque string of letters come from in the first place?

To understand the origin of our modern classification system, we must go back to the very first attempts to construct such a scheme based on the then-novel discipline of spectroscopy. Spectroscopy, as a reminder, is the measurement of an object's spectrum, the chemical fingerprint of an object woven into the colors of the rainbow; it encodes all kinds of valuable information about the object's chemical and physical properties.

Back in the 1860s and ‘70s, an Italian priest and astronomer by the name of Angelo Secchi was one of the first to apply spectroscopy to the stars. He divided stars into five categories based on their spectra. These classes were mostly arbitrary and have since been superseded, but they were an important first step in the process.

In the 1880s, the American astronomy Edward C. Pickering was compiling a catalog of stellar spectra, which resulted in the Draper Catalogue of Stellar Spectra. His assistant the Scottish astronomer Williamina Fleming divided Secchi's five classes into more specific classes with letter headings running from A to N, with a few more for unusual spectra. These categories were based on the strength of the absorption lines of hydrogen; category A had the strongest lines, then B, and so on. This is an arbitrary choice, though a reasonable one, given that hydrogen makes up 70% of the matter in the universe.

This stood until 1901, when Annie Jump Cannon, an American astronomer, rearranged the lettered categories and dropped all the letters except O, B, A, F, G, K, and M. (She also came up with the famous mnemonic in the opening paragraph.) This re-sequencing of the letter categories worked because it followed what the spectra were doing – a sequence of spectra according to Williamina's original scheme of A–N would result in the hydrogen absorption lines smoothly varying from bright to faint, but other spectral lines wouldn't necessarily follow a specific pattern. With Annie's re-organization, all the lines would vary smoothly (at least, more smoothly), although the theoretical work necessary to explain this wouldn't be fully completed until the 1920s.

[Edit 2/24/19: I've since realized that this should all be discussing absorption lines rather than emission lines as I originally put since that's what we actually see in stellar spectra. For this demonstration, at least, the idea of varying strengths still works, just realize that it's backwards from reality and when I'm talking about emission being bright/faint it should really be absorption being strong/weak.]

Below, I've made a picture to help illustrate. In this picture we have some extremely stylized spectra, with a few fictitious emission lines at various wavelengths. For the purpose of this picture, hydrogen is the emission line in the yellow part of the spectrum (although in reality hydrogen has one red line and several blue ones as seen in the Balmer Series). The left side has the spectra organized according to Williamina's original sequence, while the right side has Annie's re-organized sequence. If you watch the yellow line on the left side of the graph you'll see it smoothly varying from bright to faint as you go down. On the right, all the lines are smoothly varying, but not just from bright to faint; some go from faint to bright, while others go up and then back down.


Spectra fit nicely into Annie's scheme, but it wasn't apparent why until the Indian physicist Meghnad Saha derived a theory of ionization in the 1920s which the British-American astronomer and astrophysicist Cecilia Payne-Gaposchkin used in her doctoral dissertation to show that the sequence of spectra was actually a sequence of surface temperature. (This has been called “the most important dissertation in the history of astronomy.”) O-type stars have the hottest surface temperatures, while M-type stars have the coolest (our Sun is a G-type star, for reference).

This is an important point, and one that requires quantum mechanics to appreciate fully. Atoms emit photons of light when electrons in them drop down from a high-energy state to a low-energy state, the exact states determining the wavelength (or color) of the light. Without an external source of energy, electrons will sit around in the lowest energy state they can reach; the continuing emission of light from stars comes from the heat of the star constantly exciting electrons into higher-energy states.

Pivotally, the efficiency of this process depends on the exact temperature. Put simply, too cold and the atoms of a given element (hydrogen, for this example) won't get excited very often and thus won't put out too much light. Raise the temperature and you should get more and more excitation and the brighter light, right? This is true, but only up to a point. Once a certain key temperature is reached the emission of light will actually begin to drop off again. The reason for this is that higher temperatures actually make the electrons too excited to drop down to lower-energy states easily (or at least, make the transitions that correspond to visible light; in reality, they'll be making other transitions that correspond to non-visible light).

It turns out that A-type stars are ones where the temperature is just right for exciting hydrogen, thus giving them the brightest hydrogen lines. As you go away from A-class the strength of the hydrogen lines drop off as the stars become either too hot or too cold. And that's where that odd sequence of letters comes from!

Addendum: In reality, there's a bit more to classifying spectra than just these letters. In practice each letter class is split into ten subclasses using the Arabic numerals 0–9 (a practice also started by Annie Jump Cannon), and also a luminosity class denoted by either Roman numerals or additional letters for special cases. For instance, our Sun is classified as G2V, indicating a main-sequence star with a surface temperature of about 5,800 K.

Monday, January 26, 2015

End of an Era for the JCMT

Last night marked the last night the James Clerk Maxwell Telescope (JCMT) operated under the Joint Astronomy Centre (JAC) which has operated it since it saw first light in 1987, twenty-seven years ago.

The telescope is still on track to be transferred to its new management under the East Asian Observatory (EAO), though delays in procuring funding by EAO have led to a one-month extension of the transfer date, which is now set for the end of February. In order to save on operating costs the telescope will remain dormant for the month (starting slightly early), so last night was its last night operating under its current management.

It's going to be a strange month, as some of us at the JAC will literally have nothing to do for the month (mainly the telescope operators), while some of us (myself included) will be running around like mad trying to get a hundred and one things done in order to make the handover go smoothly. And once we finally do come to work on March 1st as employees of EAO we'll no doubt have a lot to learn trying to get the fledgling organization off the ground. Interesting times, to be sure. A hui hou!

Saturday, January 24, 2015

Reduplication in Hawaiian: A Pronunciation Aide

Hawaiian words can often be difficult to pronounce for those not used to its idiosyncrasies. This is compounded when the words start exceeding five or so syllables, even though the actual pronunciation of each syllable is quite simple.

There's a particular pattern I've noticed running through a good number of Hawaiian words, one which can really help pronunciation once you learn to spot it. As a quick reminder, all Hawaiian words are composed of one or more syllables, each of which is either a vowel or diphthong, or a constant followed by a vowel or diphthong. Most consonants are pronounced the same way they are in English, except for w which is interchangeably pronounced as either w or v (mostly due to euphony). The only new sound is the ‘okina (the little ‘ symbol), which represents the glottal stop and is pronounced by simply blocking off the airstream at the back of the the throat, like the pause in the middle of “uh-oh.” Vowels are pronounced as follows:

a…“ah,” as in “father”
e…“ey,” as in “hey”
i…“ee,” as in “machine”
o…“oh,” as in “mote”
u…“oo,” as in “flute”

Diphthongs (two vowels together) are pronounced pretty similarly to English; basically just take the two vowel sounds and run them together. Technically there are only about seven diphthongs in Hawaiian, so not every grouping of vowels is one, but for this post I'll point out any exceptions as they come up.

Anyway, the point I wanted to make in this post is there a common pattern in a lot of Hawaiian words of the form A·B·B, where A and B are usually one or two syllables. For example, take the name of the capital of Hawaii:

Hono·lu·lu

which has a two-syllable A part, and a one-syllable B part. The opposite pattern (one-syllable A, two-syllable B) is even more common, and since it's a bit longer it can be harder to parse on the fly. For example, the dynastic name of the first king of the united Hawaiian islands is:

Ka·meha·meha

Very often when encountering a word that fits this pattern for the first time, I'll try to parse it incorrectly at first, in this case something like Kame·hame·ha. Recognizing this pattern will help you pronounce such words correctly; for instance, the primary stress almost always goes on the A part of the word. (The word division here, as an aside, is “ka,” meaning “the,” and “mehameha,” meaning “lonely” or “alone.” Perhaps appropriate for the first king of the whole archipelago who was famously rather reserved and isolated growing up.)

One more example of this style is the Hawaiian word for “rainbow”:

ā·nue·nue

Here, “nue” is not a diphthong, and is pronounced as two syllables, ”nu-ey.” (The line over the a, called a “kahakō,” just means to draw that syllable out slightly longer – Hawaiian has both long and short vowels.)

When I first conceived of the post I had a whole host of words in mind to illustrate this pattern, and it figures that by the time I've sat down to write it I can't remember most of them. I'll add any new ones I think of at the end of the post in the future. A hui hou!

Edit (11/29/17): The name of the first known interstellar asteroid, ʻOumuamua, also follows this pattern (ua is not a diphthong):

ʻou·mua·mua

ʻOumuamua means “scout” (like in a military sense) from ʻou meaning “to reach for” and mua, meaning forward or ahead.

Tuesday, January 6, 2015

Hau‘oli Makahiki Hou!

Or “Happy New Year” if you don't know Hawaiian. The year ‘elua (two) kaukani (thousand) ‘umikūmālima (fifteen), to be precise. I'm back in Hawaii after a three-week trip to visit my family, enjoying the warm weather again and recovering from a mild but extremely persistent bug I picked up the last few days I was there.

While in California we took a trip to the Palomar Observatory, home to the venerable 200-inch (5.08 meter) Hale Telescope, which was the largest optical telescope in the world from 1949 to 1992 (when the first of the two identical Keck telescopes was built).

I forgot to get a picture of the telescope itself, but I remembered to at least get a picture of the dome:

Me in front of the Hale Telescope dome.
You can't tell from the picture, but it was bitterly cold up there. The telescope is at an altitude of 5,617 feet (1,712 m), and there was a glacial wind whipping by the entire time we were up there. I mention it because I decided to take my warm hat off for the picture, and very quickly found myself wishing I hadn't done so.

Anyway, here's wishing you all a pleasant new year! A hui hou!

Thursday, December 25, 2014

The Twelve Days of Christmas: Fun with Algebra

If you're like me, after hearing the song "The Twelve Days of Christmas" for the umpteenth time, you start wondering how all those gifts stack up. How many lords-a-leaping do you end up with at the end, anyway? What do you have the most of? And what's the total?

This problem can be solved by a little bit of math no more complicated than multiplication, but this being my blog I'm going to complicate things unnecessarily for fun. Let's call an arbitrary day of Christmas n (where \(1\leq n \leq12\)). The number of gifts given for the first time on that day is then also n (one partridge in a pear tree on the first day, two turtle doves on the second day, etc.). Then the total number of each gift is simply n times the number of times that gift is given. A little thought shows that this number is simply \(13-n\) (a partridge in a pear tree will end up being given on all twelve days, while the twelve drummers will end up being given only once on the twelfth day).

Putting these facts together, we arrive at a function (I'll call it "g" for "gifts") that will give us the total number of gifts of a particular type received, given a day of Christmas as input. Symbolically:
\[\text{g}(n)=n\cdot(13-n)=-n^2+13n\]This is a simple quadratic equation (a parabola, to be exact); I've marked the locations of integer value inputs in the plot below with annotations to show what each one is.


Looking at this plot, we see that the number of each gift begins at a minimum of twelve, rises to a maximum of forty-two for days 6 & 7, and drops off again to twelve on the twelfth day.

This leaves us with the question of how many total gifts you would receive from all this. Luckily, this is very simple: since the number of gifts is symmetrical after the sixth day, we can simply evaluation the following equation:
\[\text{Total gifts}=2\cdot(12+22+30+36+40+42)=364\]which, I think we can agree, is a whole lot of gifts. A hui hou!

Edit (1/16/2016): Of course, what escaped me at the time is that the song is actually about discrete gifts, not continuous ones, and thus trying to represent it as a continuous function as I did above makes pretty much zero sense.

I'd actually originally planned to do some calculus and integrate under the curve where the gray shaded part is and show how it came out to 364 as well…except it doesn't. I couldn't figure out why at the time and thus just sort of ignored it while leaving the talk leading up to the subject intact, leading to a somewhat disjointed blog post. Sometime later I realized that it's because this is a situation where you can't describe something with a continuous function; instead of a parabola, each point should be connected by a straight line—and then the area underneath that collections of points and lines should add up to 364.